Default Subscription Dashboard
Table of contents
When you log into your QuotaGuard Administration Panel, you will first see your QuotaGuard Administration Dashboard.
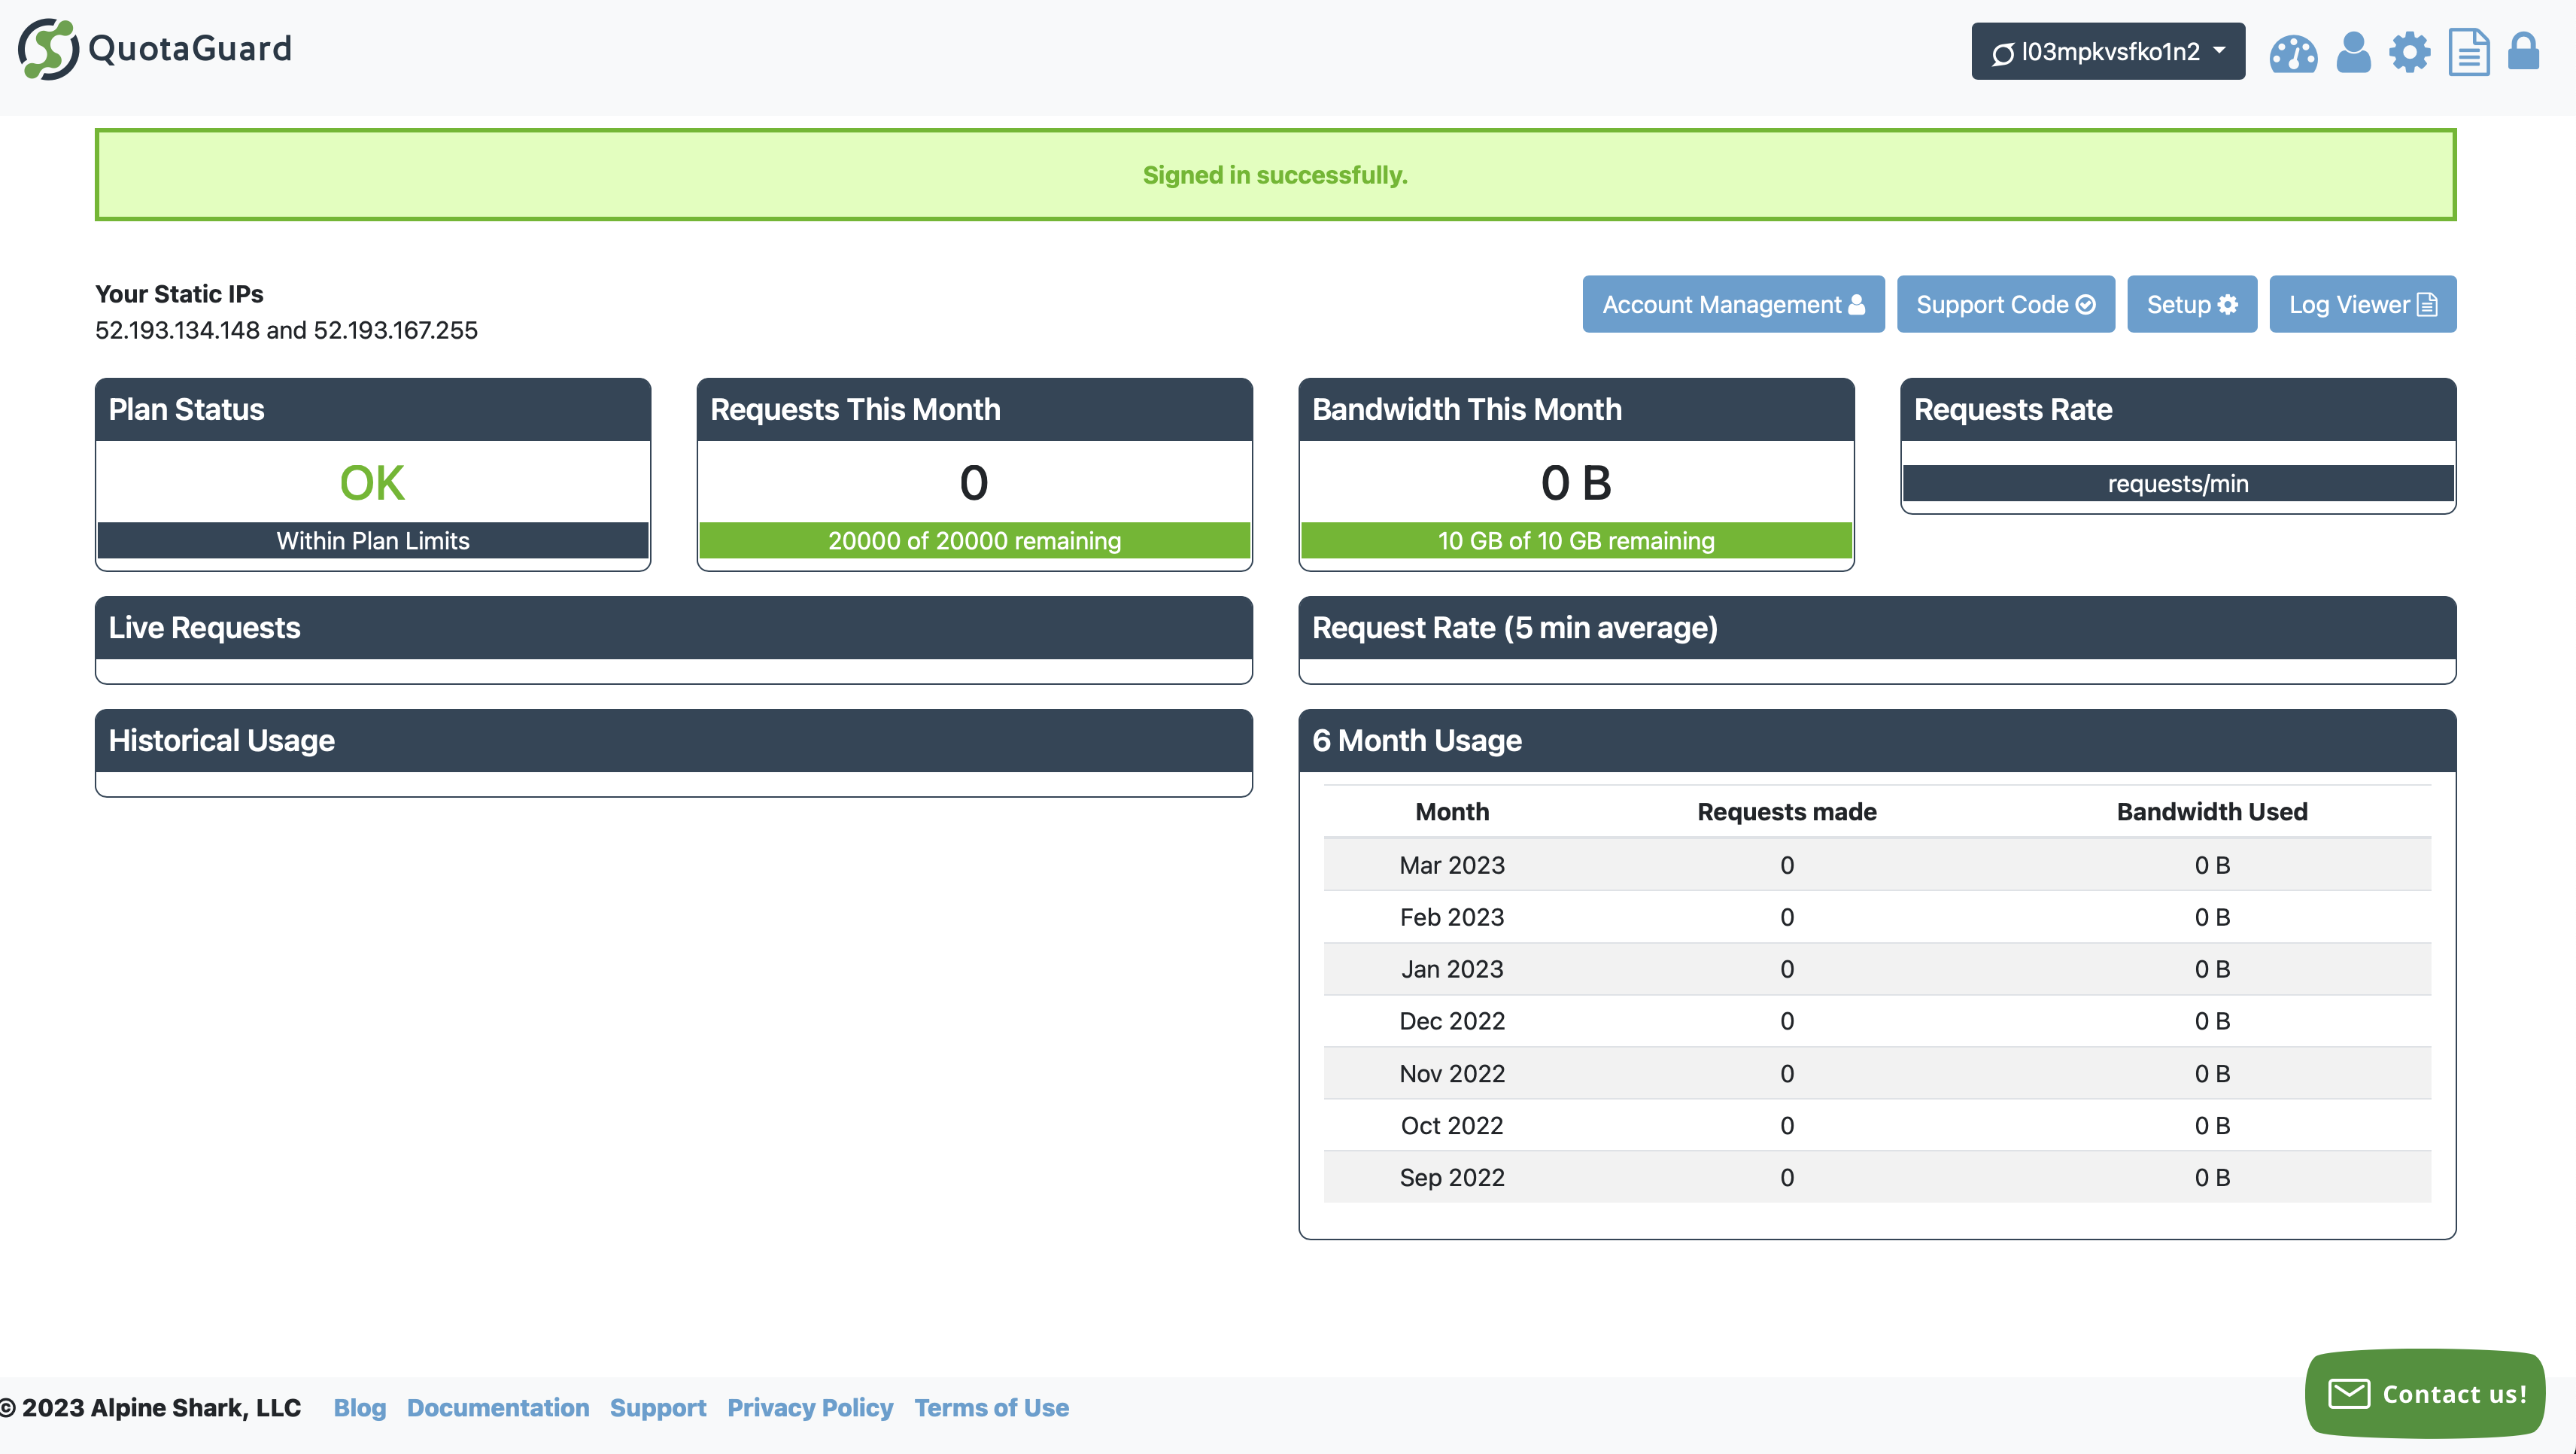
In the upper right, you will see a dropdown list with your current QuotaGuard subscription UserName. It will look something like the one in the image above, “l03mpkvsfko1n2”.
If you only have one subscription, then you will always see this default dashboard for the default UserName.
If you have multiple subscriptions, you can look at the dashboard for a different subscription by selecting the appropriate subscription from the drop-down list.
Additionally, you can select Manage Subscriptions in the drop down list and visit the Subscriptions page directly to review all of your subscriptions in one location.
Dashboard View
In the dashboard view, you can see the following metrics and useful information:
Your Static IP’s (Why do I have two IP’s?)
Plan Status
Requests This Month
Bandwidth This Month
Request Rate (Current Requests / Minute)
Live Requests Graph
Historical Usage Metrics
Request Rate (5 Minute Average)
Historical Six-Month Usage Statistics
These are metrics to help you get a quick view of your live and current usage, plan usage, and historical patterns.
Account Options
Additionally, in the upper right, you will find button links for the following areas are available:
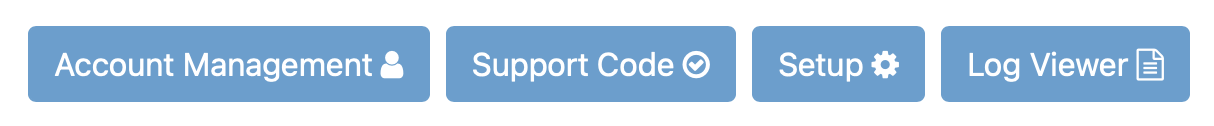
Account Management - For updating your QuotaGuard account password, credit card, downloading prior invoices, or canceling your account.
Support Code - Retrieve your Support code to authenticate your ownership of the account when contacting QuotaGuard Support.
Setup - Setup individual Inbound and Outbound subscriptions.
Log Viewer - QuotaGuard subscriptions logs page to view and request custom log exports.